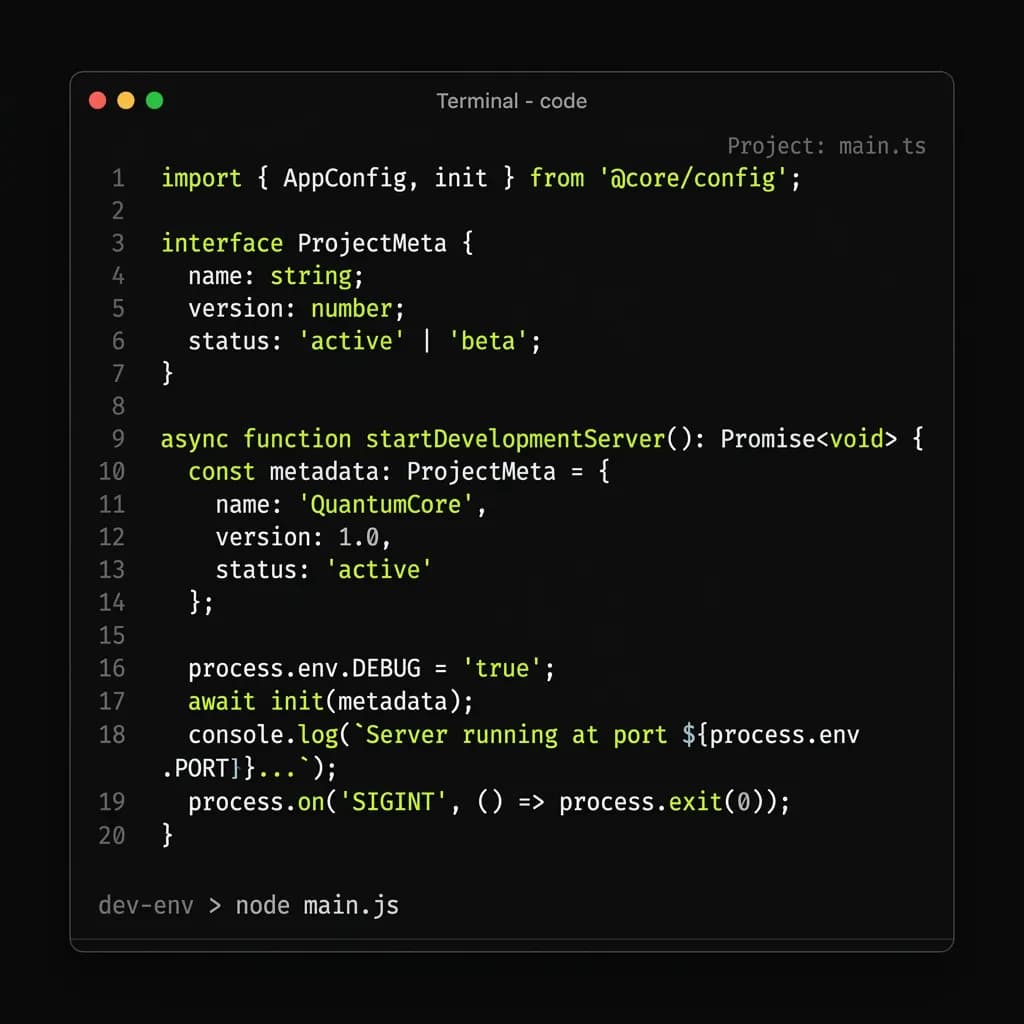
The brief for the terminal dashboard was simple: compress a noisy set of process metrics into something that fits in one terminal pane and never needs a browser tab. Two weeks, solo, real usage from day one.
Stack
Ink for layout (React components rendering to ANSI instead of the DOM — genuinely one of the more pleasant APIs I've used), plus a small polling layer that normalizes whatever metric source is configured into one shape before it ever reaches a component.
function useMetric(source, intervalMs = 2000) {
  const [value, setValue] = useState(null);

  useEffect(() => {
    const id = setInterval(async () => {
      const next = await source.read();
      setValue(next);
    }, intervalMs);
    return () => clearInterval(id);
  }, [source, intervalMs]);

  return value;
}
What got cut
- A plugin API for custom metric sources — shipped with three hardcoded sources instead. Nobody has asked for a fourth yet.
- Historical graphs. Sparkline rendering in a terminal is a genuinely hard, genuinely fun problem I did not have a weekend for.
- Config file support — everything is env vars for now, which is fine for a one-process tool.
The dependency that almost derailed it
A terminal-resize event fired mid-render on one Windows terminal emulator and Ink's reconciler didn't love it. The fix was smaller than the two hours spent finding it: debounce the resize handler by 50ms. Writing that down here mostly so future-me doesn't relearn it.